Tuesday, 26 August 2014

Why Does It Always Rain On Me?

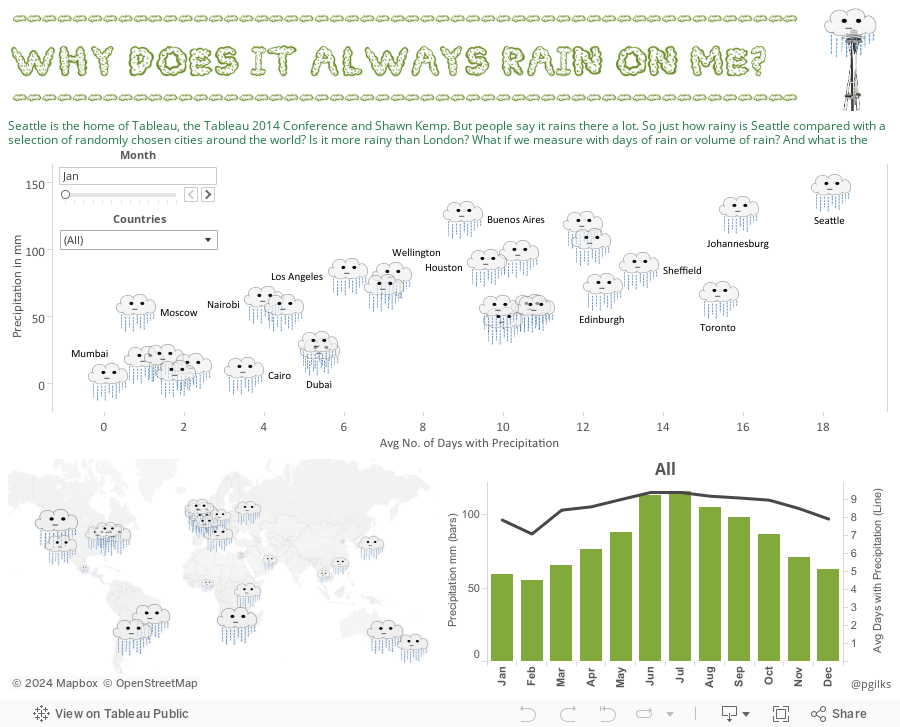
We are now only a couple of weeks away from the 2014 Tableau Conference so I thought I would make a viz in honour of Tableau's home and the location of the conference this year, Seattle. Two years in row is a tradition right? Here's what I did last year

I ruled out making a Seattle Supersonics viz as it seemed just too morbid, so I went for one of the other things that Seattle is famous for - rain!


A few things I spotted in the data:
 - London is nowhere near as rainy as its reputation. When I moved from London to New York I was convinced it was raining here more, and it turns out the data backs me up. Time to lay off the London weather jokes.
- Seattle does deserve its reputation for rain. It doesn't rain the most in terms of volume, but it does rain often.
- The rainy and dry season patterns of some places like Cairo and Mumbai are more extreme than I had previously thought.

I hope you enjoy exploring the viz, and please don't be offended if your city isn't on there, it was a pretty random selection apart from Sheffield where I grew up and it felt like it rained all the time.

Comments welcome, and hope to see you in Seattle! You probably won't need an umbrella in September.


Wednesday, 30 July 2014

Turbo Tip - solving an issue with Excel not opening due to Tableau add-in

The Tableau Excel add-in in and data reshaper is a fantastic little tool http://kb.tableausoftware.com/articles/knowledgebase/addin-reshaping-data-excel
however with some combinations of versions of the add-in and Office it can cause an issue to occur where it becomes impossible to open Excel files from simply double clicking, from within an email for example.

To fix this, use the following tip courtesy of Chuck Hooper (http://www.bialytics.com/).

In Excel go to File->Options->Advanced, scroll down to general and un-check 'ignore other applications that use the Dynamic Data Exchange (DDE)' and that should fix the issue.

Thanks Chuck!


Peter

Tuesday, 8 July 2014

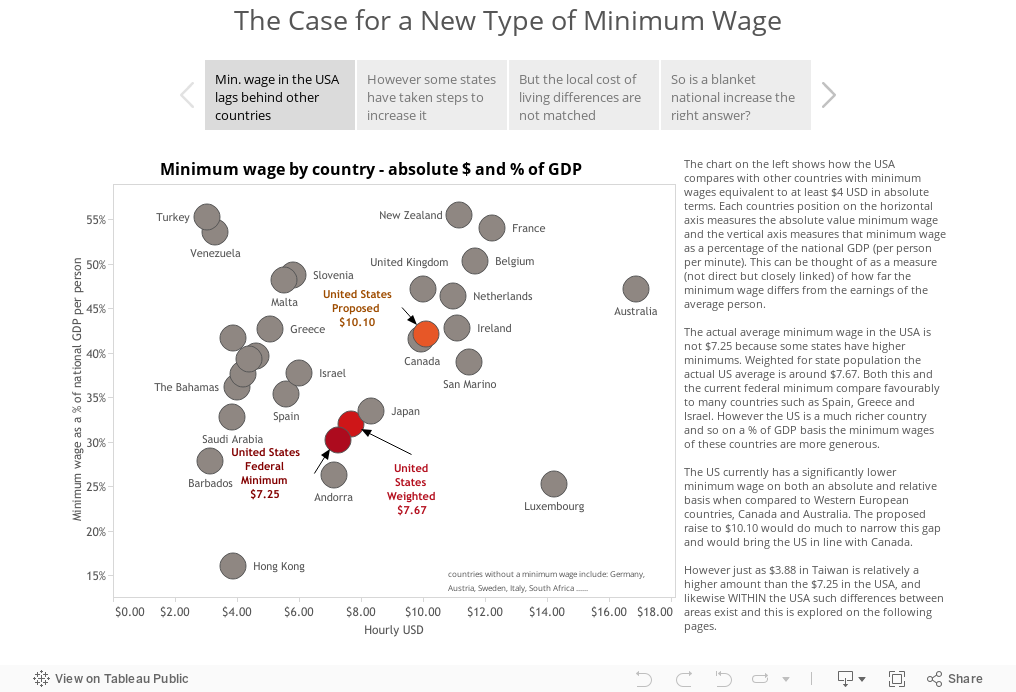
Minimum Wage - the Story Points Edition

Tableau version 8.2 recently launched and along with the long awaited Mac release (yay!) one of the main new features is something called 'Story Points'. The idea behind this feature is in Tableau's own words "a way to build a narrative from data".

So I decided to try it out and re-work one of my recent vizes into a story, using my Mac of course. I chose the minimum wage viz because it already fit into a story. The original is here, let me know what you think of the differences between the two.


A few of my early thoughts on the new Story Points feature:

To be honest, when story points was announced, I was a little skeptical for a few reasons. I’ll address each of these below.

1.       The functionality isn’t that different from having multiple tabs in a published Tableau workbook, and I know from experience that people don’t often click past the first tab in that environment so I wondered if this would be any different.

I am however seeing how story points works pretty well in leading people through the vizes. The simple and clean design change of having the story point headlines clear across the top does I think engage the viewer enough to want to click through to the next page. It also sets in the mind of the author more of an impetus to create that connected story, rather than just a series of seemingly disconnected dashboards.

2.       Its applicability in an enterprise setting seems niche, and there are other developments that perhaps should have taken precedence over this in the release cycle.

My initial reaction to story points was that it will be great for Tableau Public and for data journalists, but will have limited appeal within businesses where timely, accurate reporting is still a high priority and powerpoint rules the roost for sharing stories. I think this will be the case for a while, but I am interested to see how the use of story points develops in a large business setting as Tableau Server becomes more mainstream and business users begin to experiment with the tool.

3.       Creativity is limited compared to the single dashboard approach.

This may seem counter-intuitive, but I believe that the design thinking behind producing a single screen dashboard that allows the user to explore a story at their own pace requires a greater amount of creative thought than the creation of a guided story. I am a big fan of ‘seeing everything in one place’ and so for me story points doesn’t create that same excitement I get from seeing the single stand-out viz. Having said that, there is already some great work going out on Tableau Public so my mind is starting to change (see these examples by Matt Francis and Carl Allchin). And I’m sure that people are really going to start pushing the envelope with it as it becomes more familiar.

On a more tactical note, the current version of story points is quite restrictive in the design options available. As you will have seen from my viz designs, I’m a big fan of using images, shapes and custom fonts to add to the overall look and feel of a dashboard and help unify the theme. This is much less possible with story points as I can’t use an image for the title, and those grey boxes are very restrictive in size, color and font. Also the grey boxes suffer from a mismatch between how the words fit in desktop and how they look once published.

4.       It has been billed in some quarters as ‘the power point killer’.

I don’t see this happening for a long time! Don’t get me wrong, I love the idea of more people using Tableau to present, and when you are presenting a data heavy story I do think that Tableau story points will catch on. The main problem though is Tableau is not really designed for those ‘non-data’ elements, such as images and text. In fact to get my dashboards looking just right I often do a lot of design and creative work in powerpoint before exporting images into Tableau.
Microsoft have I think done a really solid job in improving the design functions of Powerpoint and that’s going to be hard for Tableau to compete with. And actually I don’t think they should compete on that front. In the future I see more of a split in presentation tools, Powerpoint will still exist but Tableau will be used in some more situations, as will other popular tools like Prezi.


Overall I like this addition to the Tableau tool set, but I feel its a work in progress and I expect the community and many great Tableau Public authors will help steer its development.


Thursday, 5 June 2014

An idea for a small but useful Tableau improvement

I have a new idea up on the Tableau Forums, you can check it out and vote it up here http://community.tableausoftware.com/ideas/3447

Here's the idea, its one of those small things that can sometimes drive me a bit nuts.

 - You know how sometimes you are doing something on a Tableau dashboard through server, and either you can't remember what you've been clicking on, or un-clicking your filters would just take too long? Well isn't the 'Revert' button helpful? This little beauty below:


Well I would really love to see this button in Tableau Desktop too, particularly in presentation mode. The reason is that sometimes when I am demoing Tableau I do not have either web access or specifically Tableau Server access, and so I can demo dashboards through presentation mode on desktop. But it can get a bit sticky if you need to start over.

There is a 'Revert to Saved' option but this doesn't always do the trick.

Thursday, 22 May 2014

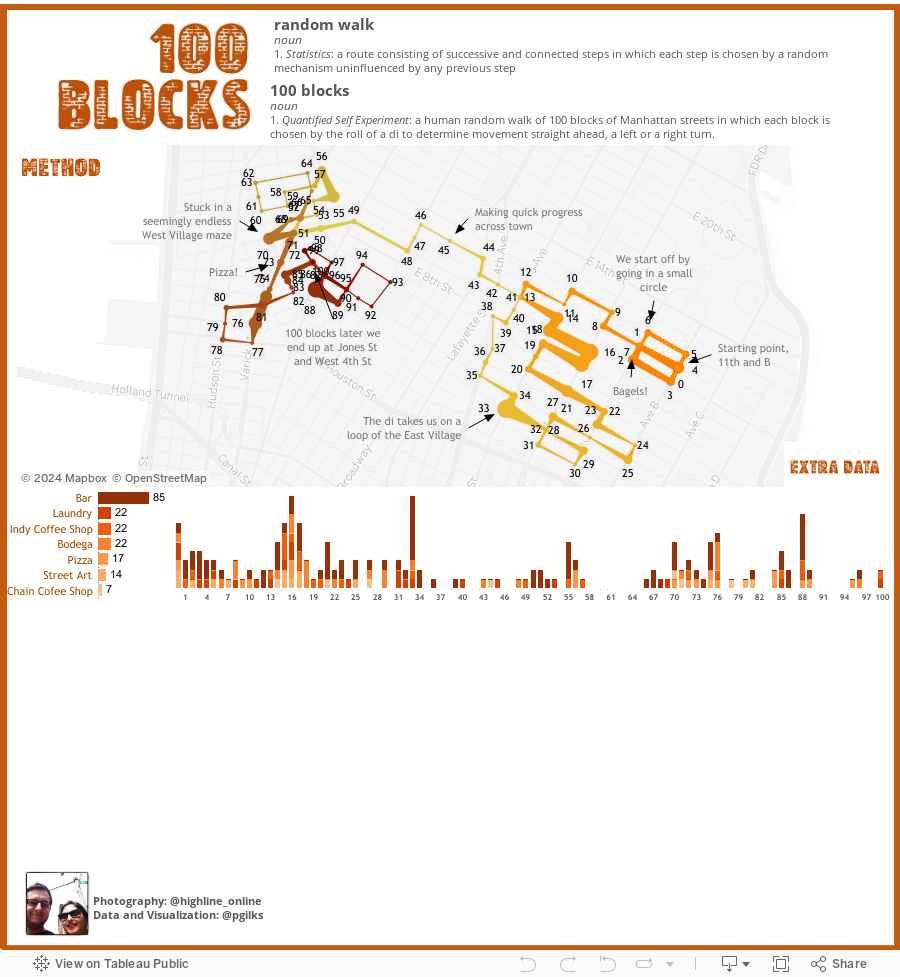
100 Blocks - A 'Quantified Self' Random Walk Experiment

When I was studying Statistics at University one of my favourite topics was Markov Chains and how they could be applied to real life situations. I was particularly fascinated by the simple Random Walk which to borrow from Wikipedia is "a mathematical formalisation of a path that consists of a succession of random steps".

What fascinated me was that random walks don't just fluctuate around an average, they usually 'go' somewhere. And there are so many possibilities of where they will go. Take this example:

Starting at point zero on a simple x,y axis for every move along x of 1, move along the y axis with a randomly chosen value of +1 or -1. You might think that all such 'walks' would just end up around the zero line, but they don't. Again borrowing from Wikipedia, here's what a bunch of such Random Walks end up looking like:


Anyway, the reason I mention this is because I've always had the rather geeky desire to do my own random walk, and by this I mean an actual physical walk - going for a stroll but letting chance determine my route. And this month, thanks to Tableau Public's Quantified Self Month, I finally got the kick I needed to actually go and do it. Plus now I live in a city built around a massive grid, where walking anywhere can be done in any number of combinations of streets and avenues, I had no excuse not to. Then of course I had to visualise the results in Tableau:

(click play for an appropriate sound track)


So how did I actually go about it? Well first off I need to give massive props to my wife Heather for doing this with me, helping come up with the plan and doing all the photo and photoshop work for the viz. Here's what we did:

 - We decided on a few rules
1. We would start the random walk close to home, at the intersection of Avenue B and 11th St.
2. We would roll a di (actually an iphone app called Dice Roller) and take the following actions:
    - Roll 1 or 2: Turn left and walk one block
    - Roll 3 or 4: Go straight ahead and walk one block
    - Roll 5 or 6: Turn right and walk one block
3. We were not allowed to go down the same block twice (to keep us sane)
4. If an intersection has less than 3 options, split the probability equally.
5. Walk for exactly 100 blocks and see where we end up

Here we are at the start:


Then we walked! And along the way we recorded a few of the things that we passed in order to give a flavour of the streets we were going down and how they differ. The, fairly random, list of things we recorded were:
 - Bars (just bars, restaurants with bars didn't count)
 - Laundries and dry cleaners
 - Independent coffee shops
 - Big chain coffee shops
 - Street art (loosely defined)
 - Pizza shops
 - Bodegas and delis

In retrospect I wish we'd recorded the number of psychics, because we definitely passed a lot of them! In order to record everything we passed, the street names and the results of the di throws we used the latest in data collection technology:


Heather also took a photo of every intersection and a photo of something on the block, which you can see in the viz.

Well the whole thing took a whopping six and a half hours, including a few rest stops for bagels, beer and pizza. And we also saw a surprise street market, the Hells Angels club house and a bit of a rain storm. But I was impressed with how far we travelled, we certainly took the long route but we ended up going completely East to West across Manhattan before basically going round and round in circles in the West Village (one part of Manhattan where the grid goes a bit skewy). I'm pretty happy with the results, it was a long day but worth it. Its an interesting way to discover your city and takes you down streets you may never otherwise go down.


Oh, and we took a taxi home.


Wednesday, 30 April 2014

How I built BALLCODE

My last post, BALLCODE: Scanning the 2013-14 NBA Season has been quite popular, has sparked some debate and has also (very generously I think) made an appearance in Tableau Public's round up of Tableau Tips Month as the 'most beautiful tip'. All of which is lovely. However its dawned on me that my tip portion of the blog post was pretty short so I'm going to expand here to show how I made the viz.

First up I'd like to clarify the origin of the chart type. For a long time I've wanted to do something with small multiples as I really enjoy these visualisations, they give you so much to mull over and you can make lots of comparisons on a single page. Small multiples don't have to be charts, they can be pictures too, like this one we have on our wall at home. Delicious!


I also love the NBA, so I patiently waited until the end of the regular season in order to be able to achieve my goal: Show all the results of the NBA season, by team, in a single small multiple visualization.

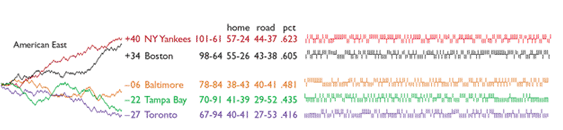
My original idea was actually to use line charts, but when I tried this it looked pretty crappy. So I switched around the chart types and fell into bar charts, which I realised was pretty cool as they reminded me of bar codes, AND quite clearly showed the wins against the losses. When I did this I thought it was a pretty original idea, but of course it turns out I was beaten to it some time ago by the king of visualization Edward Tufte (Jonathan Drummey made the spot). Tufte did this chart for baseball teams as sparklines 


So my idea wasn't totally original. But nonetheless I'm pretty happy with how it turned out, and I think the addition of  a colour split between both team and win/loss has worked out pretty nicely.


So...... here's how I made it:

First up I had to get some data. Fortunately NBA data is pretty easy to come by thanks to the good folks at http://www.basketball-reference.com/. Unfortunately, a seasons worth of results data includes one row for each game. Where as I needed to be able to visualize each game twice, once from the perspective of the home team and once from the perspective of the visiting team. In order to do this I copied the data out into Excel twice (two big lists of every game stacked together) and then did a few functions. Here's how the top half of the Excel sheet looked:


Columns A to E are straight from basketball-reference.com. The rest of the columns I created.
F (Team) = The visiting team
G (Place) = Where the game took place for that team (i.e. always 'Away')
H (Win) = 1 if Team won, -1 if Team lost
I (Team Score) = the score of Team
J (Opponent) = the other team
K (Opponent Score) = the other teams score
L (Date) = a string function of column A which ignores the day
M (List) = a simple index of each NBA game in order 1 to 1230


The bottom half of the Excel sheet then looked the same, except this time I switched it around so that 'Team' now refers to the Home team and the results are shown from their perspective:


Bingo! Two rows for every game, one from each teams perspective of home/away and win/loss.

I also wanted to organise the teams by division so I created a little look up table in the same Excel file to join to in Tableau:


So now I had my data for Tableau I made the connection and started doing some vizzing. As stated above, my first idea was to do a series of line charts, but I soon decided this wasn't going to work very well because of all the back and forth between winning and losing:


So I played around and decided on bar charts, which look a bit weird in the worksheet view where they are all really tall, but work well in the dashboard when they are squished vertically. I made the bars as narrow as possible and put in levels of detail to get each game in order of date.


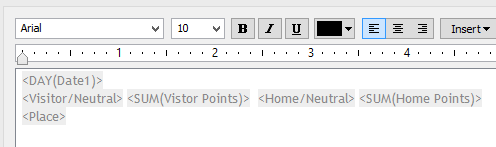
A couple of things to note, here's the tooltip:


And here's how the colours work:


Its been pointed out in the comments to the original post that the colours don't add any additional insight and could constitute 'chart junk'. Which is true, and probably not good practice in a business context, but in the case of things like sports teams I think the visual clues that the colours give create both a positive emotional response to the viz and also provide another quick way to find the team you are looking for (i.e. if you are looking for the Bulls, look for red).

So with one worksheet per division I then put these together in a tiled dashboard, very carefully adjusting the tiles to try and evenly distribute the 6 sheets. I also left room for a title and usual turned to dafont.com for a snazzy title. Something I've started doing to save time if I'm just doing a fancy title is instead of downloading the font, I use the preview in DaFont and take a screen grab. The colour can then be changed later in powerpoint or photoshop or anything else.


Hit Save to Web, done.


PS - a note on spelling. As an Englishman now living in the US my use of spelling and grammar is all messed up as I navigate cross-language spell checkers, auto correct, colleagues, clients and my 32 years of built in habits. So I apologise/apologize for the inconsistency.



Thursday, 17 April 2014

BALLCODE: Scanning the 2013-14 NBA Season

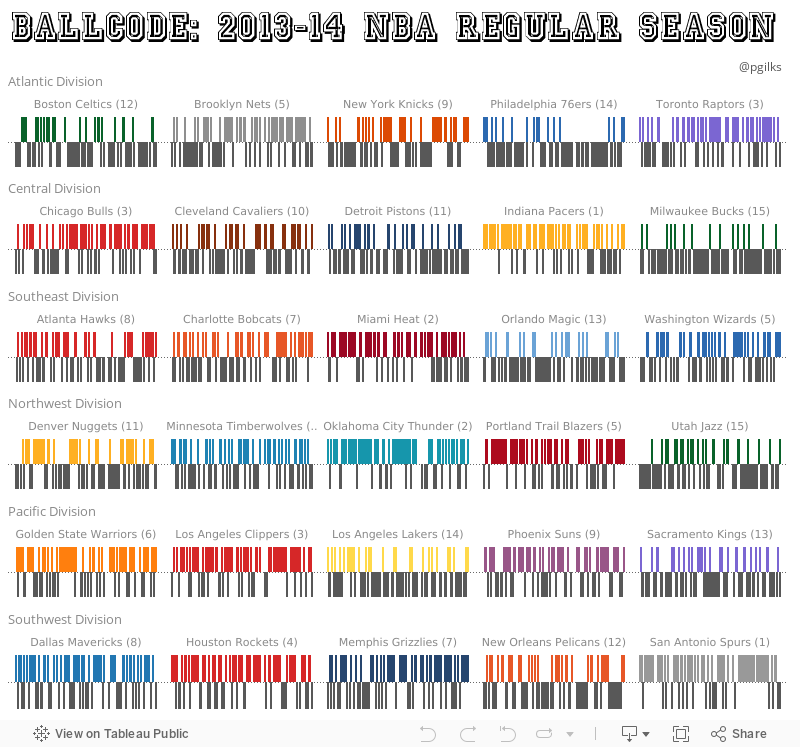
The 2013-14 NBA Regular Season finished last night. I'm really excited about the playoffs this year, particularly in the West where there are going to be some epic match ups. But before we get to that I wanted to make a viz which would summarise all the games played into a single view. So here it is:


As you can see I've tried to represent each teams season as an individual bar code representing their performance over the season. Let me know if you think it works, I'm purposefully trying to make some vizzes which are a bit 'non traditional since this blog is a bit of creative space.

And since its Tableau Tips Month on Tableau Public http://www.tableausoftware.com/public/blog/2014/04/tableau-tips-month-2419 here's a little design tip too.

In order to present each bar code with a single colour for losses, and a team based colour for wins I used the following table calculation:


and then assigned one colour for 'black' and each other team colour separately. (Note each Division is a separate worksheet).


This is a simple version of a technique I use a lot, mixing a colour scheme based on one or more fixed values, and some values that change. This helps with say highlighting an individual item driven by a parameter selection, exactly the same idea.

That's all for now. Enjoy the Playoffs!