First up I'd like to clarify the origin of the chart type. For a long time I've wanted to do something with small multiples as I really enjoy these visualisations, they give you so much to mull over and you can make lots of comparisons on a single page. Small multiples don't have to be charts, they can be pictures too, like this one we have on our wall at home. Delicious!

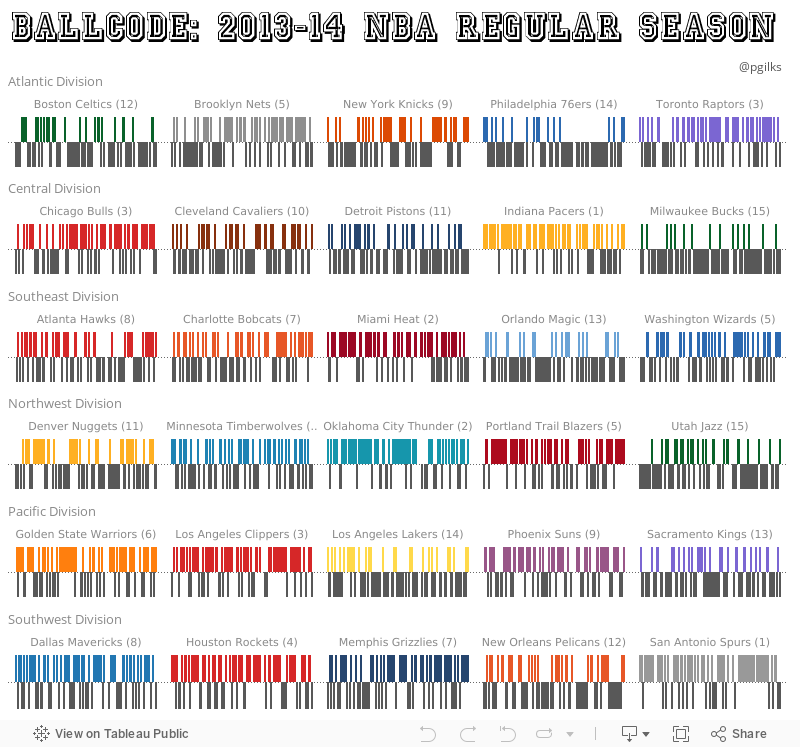
I also love the NBA, so I patiently waited until the end of the regular season in order to be able to achieve my goal: Show all the results of the NBA season, by team, in a single small multiple visualization.
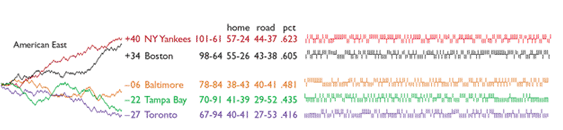
My original idea was actually to use line charts, but when I tried this it looked pretty crappy. So I switched around the chart types and fell into bar charts, which I realised was pretty cool as they reminded me of bar codes, AND quite clearly showed the wins against the losses. When I did this I thought it was a pretty original idea, but of course it turns out I was beaten to it some time ago by the king of visualization Edward Tufte (Jonathan Drummey made the spot). Tufte did this chart for baseball teams as sparklines
So my idea wasn't totally original. But nonetheless I'm pretty happy with how it turned out, and I think the addition of a colour split between both team and win/loss has worked out pretty nicely.
So...... here's how I made it:
First up I had to get some data. Fortunately NBA data is pretty easy to come by thanks to the good folks at http://www.basketball-reference.com/. Unfortunately, a seasons worth of results data includes one row for each game. Where as I needed to be able to visualize each game twice, once from the perspective of the home team and once from the perspective of the visiting team. In order to do this I copied the data out into Excel twice (two big lists of every game stacked together) and then did a few functions. Here's how the top half of the Excel sheet looked:
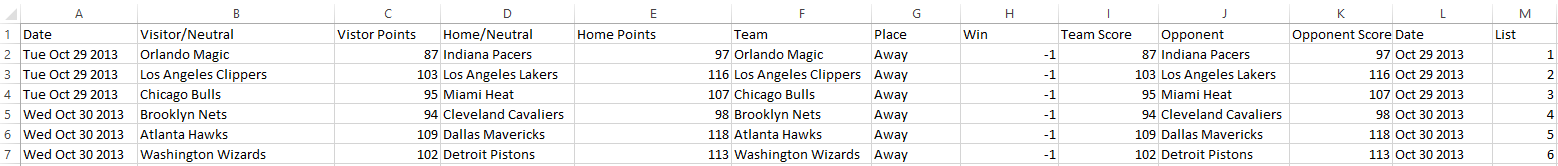
Columns A to E are straight from basketball-reference.com. The rest of the columns I created.
F (Team) = The visiting team
G (Place) = Where the game took place for that team (i.e. always 'Away')
H (Win) = 1 if Team won, -1 if Team lost
I (Team Score) = the score of Team
J (Opponent) = the other team
K (Opponent Score) = the other teams score
L (Date) = a string function of column A which ignores the day
M (List) = a simple index of each NBA game in order 1 to 1230
The bottom half of the Excel sheet then looked the same, except this time I switched it around so that 'Team' now refers to the Home team and the results are shown from their perspective:
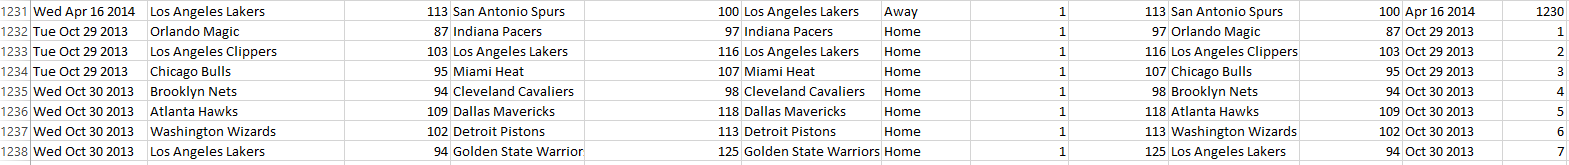
Bingo! Two rows for every game, one from each teams perspective of home/away and win/loss.
I also wanted to organise the teams by division so I created a little look up table in the same Excel file to join to in Tableau:

So now I had my data for Tableau I made the connection and started doing some vizzing. As stated above, my first idea was to do a series of line charts, but I soon decided this wasn't going to work very well because of all the back and forth between winning and losing:

So I played around and decided on bar charts, which look a bit weird in the worksheet view where they are all really tall, but work well in the dashboard when they are squished vertically. I made the bars as narrow as possible and put in levels of detail to get each game in order of date.

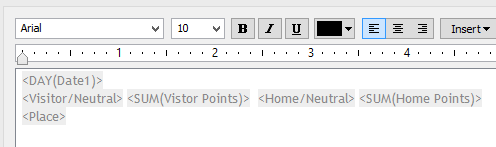
A couple of things to note, here's the tooltip:
And here's how the colours work:

Its been pointed out in the comments to the original post that the colours don't add any additional insight and could constitute 'chart junk'. Which is true, and probably not good practice in a business context, but in the case of things like sports teams I think the visual clues that the colours give create both a positive emotional response to the viz and also provide another quick way to find the team you are looking for (i.e. if you are looking for the Bulls, look for red).
So with one worksheet per division I then put these together in a tiled dashboard, very carefully adjusting the tiles to try and evenly distribute the 6 sheets. I also left room for a title and usual turned to dafont.com for a snazzy title. Something I've started doing to save time if I'm just doing a fancy title is instead of downloading the font, I use the preview in DaFont and take a screen grab. The colour can then be changed later in powerpoint or photoshop or anything else.

Hit Save to Web, done.
PS - a note on spelling. As an Englishman now living in the US my use of spelling and grammar is all messed up as I navigate cross-language spell checkers, auto correct, colleagues, clients and my 32 years of built in habits. So I apologise/apologize for the inconsistency.