Tuesday 21 January 2014

Crowdsourcing - The World's Biggest Stadiums

OK so here's a viz I made just because I felt like it :-) No other reason at all.

Its looking at the biggest stadiums (or stadia if you like) in the world, specifically those with a capacity of at least 60,000. You can hover and filter to select different sports and regions, and a picture of each stadium should pop up.


A few things I noticed from the data:
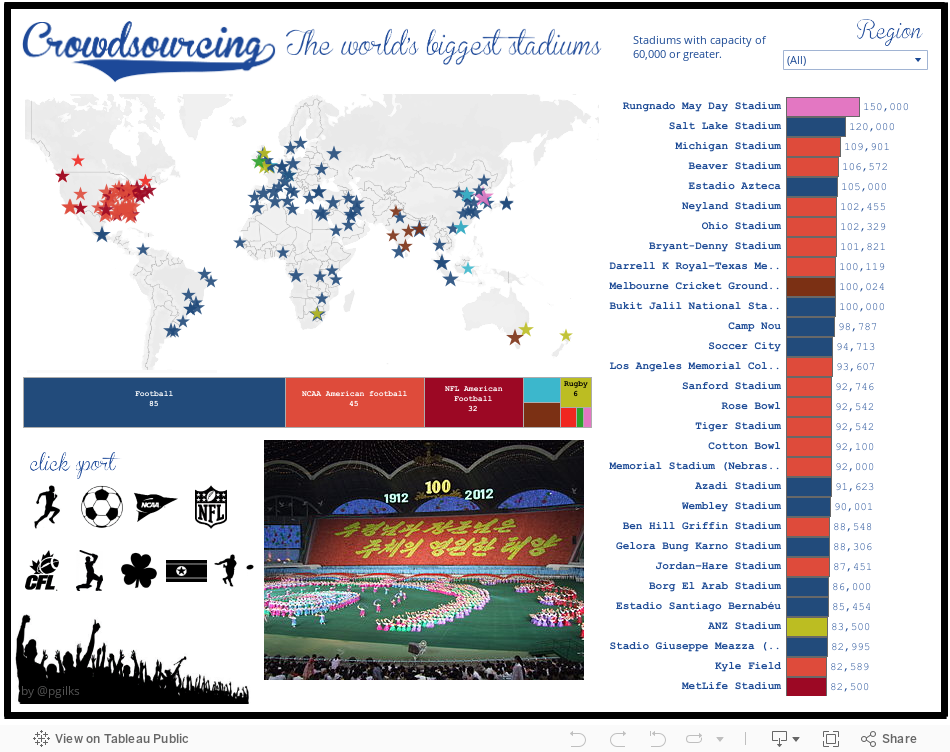
1. College football stadiums in America are HUGE. They make the NFL stadiums look tiny. Think about this for a second - these are teams run by institutions of higher education with unpaid players and there are some 46 teams with seating for over 60,000 people. The biggest, Michigan Stadium, is the third biggest stadium in the world. The Premier League by comparison has 2 teams that meet this criteria.
2. I was surprised by the lack of baseball stadiums. I guess it has to do with the shape and size of the field. The biggest baseball stadium is Dodger Stadium with a capacity for 56,000.
3. There are big stadiums really all over the world. There are loads in Africa and Asia, and pretty much everywhere. There are definite regional differences between the sports enjoyed, and these become obvious in the map. The UK is probably the country with the greatest diversity of sporting venues at this level.
4. I'd quite like to go to the 'Mass Games' in North Korea, its probably quite a sight!


Peter

NB - I lumped Rugby Union and League together, sorry if that bothers anyone. Also I tried to pick the 'primary' sport for each venue but may have got this slightly wrong, if you spot a mistake, please let me know.


Thursday 16 January 2014

Copy and Paste within Tableau is your friend

Ok here's an admission. Table Calculations sometimes confuse the heck out of me. However I've developed a few little tricks I use to make life easier. Here's one I utilised in my latest Tableau Public viz.

Lets say you've been using the cool new Rank feature in Tableau 8.1 on loads of fields, but then you want to filter your data and NOT have the ranks recalculate. What do you do? There are probably many ways to skin this cat, however here's the one I used. It may not be the 'best' way, but I like it. As usual I'm going to use Superstore Sales data to demonstrate.

First I'm ranking all countries by four fields:


Ok good, and I've sorted by the rank of Discount to make the order clear. Now I tidy things up a bit and add a quick filter on country:


Now you see I've de-selected a few countries, and they have disappeared from the view, but the rank has re-calculated. That's expected behaviour, but in my case I didn't want the ranks to recalculate. So here's what I do to fix the rankings (I think of this like doing a copy and paste values in Excel when you want to stop the formulas from calculating).

First, put everything back in the filter.

Then hit CTRL+C

Open a new worksheet

hit CTRL+V

and bingo I now have a new hard-coded data set from the clipboard!


This data set includes only four fields:
Country
Measure Names - Rank of Discount, Rank of Profit, Rank of Sales, Rank of Shipping Cost
Measure Values - the original 'hard-coded' ranks for each
Number of Records

So now when I filter out countries, the countries disappear from the view but the ranks stay as they were:


and then this can be easily brought into a dashboard along with the main data set by using data blending on country.

And all's well that ends well.


Wednesday 15 January 2014

Comparing University League Tables

Today's Viz of the Day http://www.tableausoftware.com/public/gallery/more-net-costs by Jon Boeckenstedt of Higher Ed Data Stories, which shows the relative costs of US university tuition, got me thinking about doing a viz on UK universities. Since they all basically charge the same price I was going to have to look at something other than fees (though there is a rather sad story in the trend for increasing UK tuition fees overall, perhaps a story for another day).

Here's the viz:


The main story is that at the very top end of the tables, both newspapers are in complete agreement with each other - Cambridge, Oxford, LSE and St Andrews making up the top 4 for both. After that, the two begin to differ leading to a maximum ranking difference of some 43 places for Anglia Ruskin University.

Creating the composite rank was fairly straightforward using Tableau's new RANK function in version 8.1. I simply averaged the two ranks, and then ranked that average! A note on ranking styles - The Guardian uses 'competition ranking' (e.g. 1,2,2,4) where as The Sunday Times ranks are unique. For the composite rank I used competition ranking.


PS - do you believe for one second that St Andrews should be above UCL? Treasonous if you ask me.