Sunday 28 July 2013

Tableau Public Social Media Contest - my entry

Tableau Public have launched another viz competition, this time asking entrants to come up with viz's based on social media. Here are the details http://www.tableausoftware.com/public/social-media-contest

I was having a hard time thinking of how to get to some useable data for niche topics, and in the end decided I could make a better viz by using one of the datasets that Tableau suggested, this being facebook usage statistics by country.

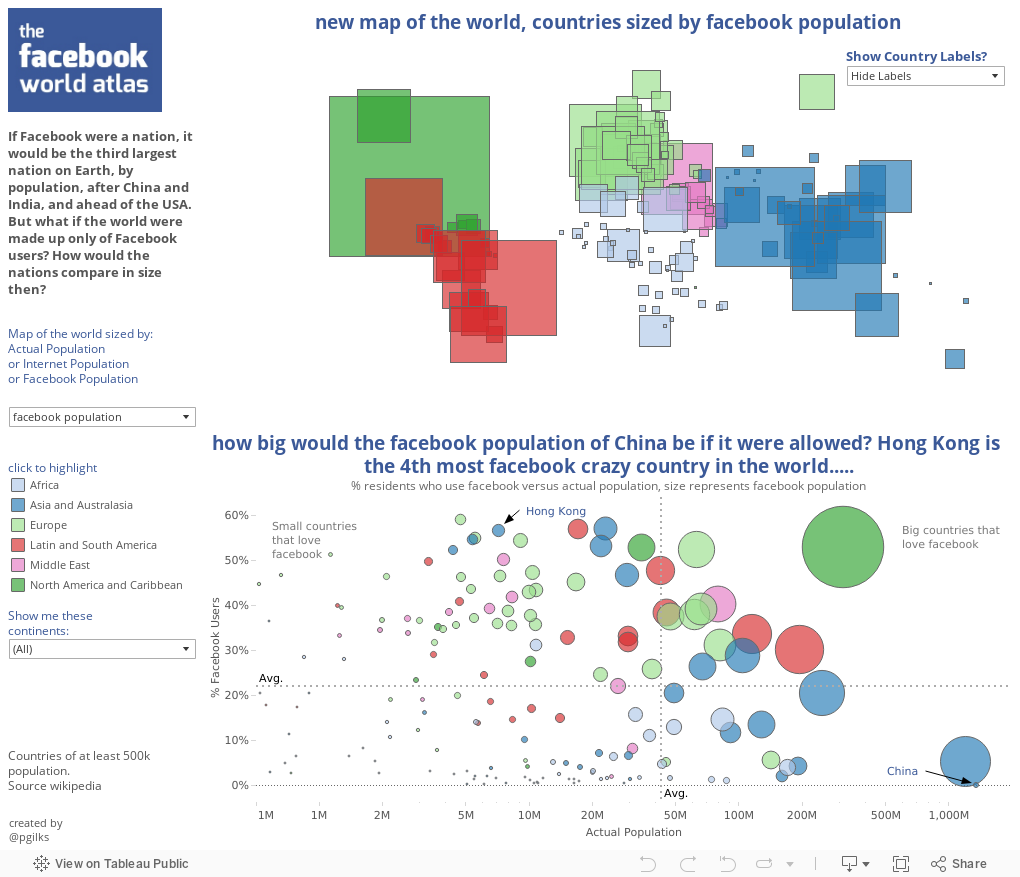
And so I re-drew the map of the world, sizing countries by their populations of facebook users. And for reference you can use the parameter controls to show alternate versions sized by actual population or internet using population. Doing this reveals clearly how big an impact the restriction on facebook in China has.


What do you think?

By the way, the font I used is not the same the one facebook uses, but is similar, the title uses Exo, the body uses Lucida Sans.

Thursday 4 July 2013

The GRUNT-O-METER. A viz in honour of the tennis at Wimbledon


With Wimbledon coming to a close yet again it seemed timely to produce a tennis themed viz.

In recent years the 'grunts' produced by female players while giving the ball a good whack have garnered a lot of press, so I thought it might be fun to look at the games' louder grunters, and see if their lung power has any impact on their career success. I'll let you take a look at the data and figure the answer to that out for yourself :-)

As with the Hopometer, the idea and much of the design and image sourcing is down to @highline_online.

Here's a recent clip of the top two, cover your ears!