So here are a few of my top tips for making simple but effective formatting changes in Tableau. Of course you might disagree with these, and that's also fine :-)
1. Lose the lines
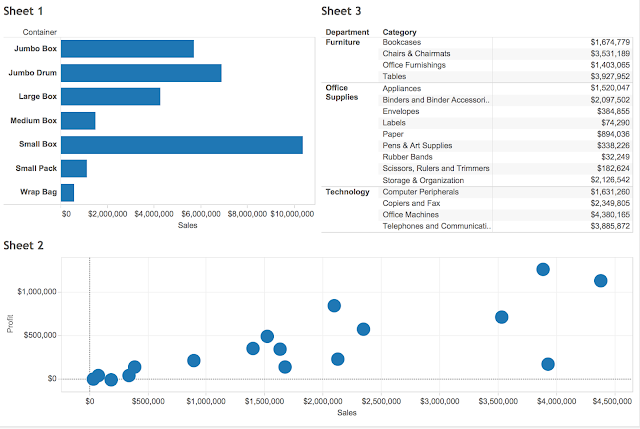
By default, most chart types in Tableau come with axis lines, borders and reference lines. I like to get rid of almost all of these. Say we have this view below:
First I'm going to get rid of the borders by turning off row and column lines:
and do this for all of the sheets. But I am going to keep some row lines for the table, to differentiate between the departments.
Then I also like to turn off the grid lines on scatter plots, most of the time these are completely unnecessary (IMO). To do this you use the paintbrush icon in formatting. I sometimes like to turn the zero lines off too, but not always, that really depends on how important being above or below zero is. In the example below, I'm going to keep the zero lines but make them a lighter tone of grey.
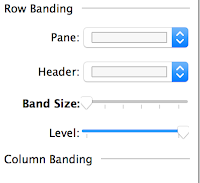
And finally I'm going to lose the row shading from the table by just moving the row banding to zero:
And from just making those simple changes, our dashboard is already looking a lot cleaner....
2. Sweat the fonts
Font consistency is a very important part of giving a dashboard a overall look and feel. Often font choice is limited because of the server you will be publishing to, for example Tableau Public has these fonts available. However that's never an excuse for inconsistency, even if you have to use Arial everywhere. Font consistency does not mean that every word has to be written in the same size or color, but there should not be too much variety - I try to stick to a maximum of three different sizes and two different colors per dashboard. Often those colors will be a black or dark grey, and a color relevant to the topic or company.
BUT here's one thing you absolutely must do with every dashboard!!!!!
For some unknown reason Tableau defaults all fonts to Arial except titles, which it sets to Trebuchet MS. Please, please, please change this when you are changing your titles.
3. Be significant with your figures
Number formatting is a detail that's more important than you might think and should not be overlooked. Always consider "at what level are these numbers significant?" and work from there. For example, if we are looking at the salaries of NBA players, do we need to see the cents? Definitely not. Do we need to see even the dollars or the thousands of dollars? Most likely we don't need to see those either. Which of these do you think offers the best comparison for ease of understanding?
Personally, I would go with Option 4. NBA players are paid in the millions, so who cares about the last dollar? BUT the single decimal place still lets me see that Dwight Howard is paid more than Chris Bosh.
When working with number formats, also consider using different units and decimal places for the axis and the pane. The Axis probably needs less detail than a label or a tooltip.
And don't forget to always include a $,£,€ etc... sign if you are dealing with currency.
4. Create space
Sometimes Tableau dashboards can seem a bit cramped, don't be afraid to use white space, or dividing lines to create separation and breathing room for your charts.
If you are building on completely floating objects, you can obviously control exactly where you want things to go. But I like to use tiles (much to the chagrin of some of my colleagues) because I find it faster to iterate the placement and design and the published version is more likely to look like the desktop version. If you are a tile fan like me, try adding blank tiles between sheets:
5. Hide field labels for rows (and other unnecessary labels)
In the picture directly above you see the title 'Sales by Container', and then also on the chart a field label telling us that we are looking at the Container field. This is completely redundant. Your audience aren't stupid, they know if the title says 'Sales by Container' that they are looking at containers, so hide that field label!
Also, do your audience need to be told that Jan, Feb, Mar etc... are months? That 2014, 2015, 2016 are years? Or that New Jersey, New York and California are States? I doubt it, so save the space and get rid of any and all redundant labels.
BUT that's not to say all labels are bad - you might have two fields in play that are not so obviously distinguishable. And always consider your audience....
6. Labels beat axes
Some might find this tip a little controversial, but I am nearly always a bigger fan of labels than axes, especially for bar charts. There are two reasons for this:
1) If you do want/need to know the number as well as the relative size, its a lot easier to read it at the end of the bar than keep scanning your eyes up and down to the axis.
2) Axes look kinda ugly
So get rid of the header and add some nice labels instead :-)
And there are your 6 simple tricks! Of course there are many more design elements to consider, like color, story, actions, filters, text, pictures, sizing, tooltips, layout etc.... But even with these easy and quick changes we've managed to make our dashboard look a lot more professional than the default view we started with. Don't you think?
PS - apologies to BuzzFeed


I"m sure coming again to construe these articles and blogs wordpress themes
ReplyDelete