Well its been a while, but here's a new viz showing the Kings and Queens of England.
This one was a labour of love and was made with help from my friend and pinball team captain Dan Miller who did the illustration and came up with the overall look and feel. You can see more of Dan's work here http://toothpicksandgum.com/ and here http://instagram.com/manmiller and follow him on twitter @metropolus.
One thing that I would have liked while making this viz is transparent backgrounds for sheets.
Oh and please note that the data collection took bloody ages, so if you spot any errors please let me know. And the countries are the modern equivalents - identifying individual US states under different monarchs got a bit much to deal with.
Monday, 16 February 2015
Tuesday, 30 December 2014
One of the things Tableau is.....
A few days ago Paul Banoub posted this on Twitter:
and yesterday Dan Murray of Interworks posted this blog entry describing his thoughts on what Tableau is and what Tableau isn't. And I agree with everything Dan wrote (he is a smart man after all!).
However there was one thing missing from Dan's description of what Tableau is and it got me thinking that I need to blog about it.
At this point you might be thinking "no shit Sherlock" but I think this is something I need to write about, so first a little history of my journey with Tableau.....
and yesterday Dan Murray of Interworks posted this blog entry describing his thoughts on what Tableau is and what Tableau isn't. And I agree with everything Dan wrote (he is a smart man after all!).
However there was one thing missing from Dan's description of what Tableau is and it got me thinking that I need to blog about it.
One of the things Tableau is is the best tool yet created for data exploration
At this point you might be thinking "no shit Sherlock" but I think this is something I need to write about, so first a little history of my journey with Tableau.....
I first came across Tableau in 2010 when working at Barclaycard in the customer insight team. A lot of my job revolved around extracting information about our customers from transactional databases, finding the interesting nuggets in the data and basically turning that data into stories to provide 'insight' for use in product development, strategy and marketing decisions. In practical terms what that meant was writing code in SQL or in SAS, exporting aggregations of data to Excel to produce charts and then converting these to PowerPoints.
The thing is that this process is not particularly forgiving when there is an error in the data, or when the data story you were looking into turned out to be not very interesting or insightful. Starting the whole process again was a time consuming effort and on the fly analysis, while possible, was sometimes painful.
When I first started using Tableau, thanks to an introduction from my then new colleague Brian O'Connor, I actually had the 'personal' version which did not allow direct connection to databases. And so I was using Tableau only against Excel files. It made my life easier even then, but I was mostly using it as simply a way to make charts a lot prettier than they were coming out of Excel.
And then Brian and I had our Eureka moment. We attended a Tableau meet-up in London for a preview of version 6.0 and saw what the then small but enthusiastic group of users (including one Tom Brown) were doing with it and we realised we had only scratched the surface.
So after that my job and career took a dramatic turn for the better. I was plugging Tableau directly into Teradata, analyising data on the fly, finding outliers, spotting possible data errors, seeing patterns and relationships and testing out scenarios at 100 times the speed I had before. I started being able to turn around answers to questions in seconds rather than minutes and began doing analysis sat side by side with my colleagues from different business teams, working together to find the stories in the data before shipping off the results to PowerPoint.
And for a long time that's the only way I used Tableau. I am very happy to admit that I had never even heard of the words Business Intelligence, had no background in IT and had no concept of things like Cognos and Business Objects. I did not produce dashboards, or manage servers, or consider how other people would use Tableau, I was using it for my own needs.
That is what I mean by 'data exploration'. Its the process of plugging directly into some data and experimenting until you find an answer to a question you may have never known existed. I think its the most important part of using Tableau (and its the reason why I still do not plan out a dashboard before I play with and understand the distribution and relationships of the data).
And that's why I'm writing this blog post. Because when I look at everything I've done so far on this blog, its mostly been in the context of using Tableau to produce nice looking and user friendly dashboards for other people to consume. But if you took all that away, if took away Tableau Server, Tableau Public, Tableau Online, took away Story Points and even just the ability to produce dashboards in Tableau desktop - it would still be my favourite piece of software ever produced.
PS - have a nosey around here for some interesting background on the development of Tableau
Wednesday, 3 December 2014
Guest Post! A look at the success of the UCONN basketball team over the years
I've been a bit distracted from blogging recently so new posts haven't exactly been coming thick and fast. BUT you are in luck, because my colleague Chamberlaine Kerr has come up with a cool basketball related viz and she's chosen this as the place to debut it.
Chamberlaine also works for Slalom Consulting and is helping to drive growth of the data visualization practice at our Hartford office. This is Chamberlaine's first foray into the world of Tableau Public and I think its a good one. You can find her on twitter as @ChamberlaineK
In February, 2012 I started my career with Slalom Consulting at our headquarters in Seattle. After roughly one-and-a-half years I relocated to Hartford, Conn., and joined Slalom’s Information Management and Analytics practice.
Prior to Slalom I attended the Foster School of Business at the University of Washington – go Dawgs! After moving to Connecticut, I quickly realized we aren’t the only Huskies around. I now refer to my alma mater as the Huskies of the Best (oops! I mean West*) coast.
I’d like to say a huge “thank you” to my Slalom Consulting colleagues Peter Gilks (for allowing me to take over his blog for the day) and Curtis Looney (for helping with the original POC). Hopefully my own blog will be a part of the not-so-distant future. In the interim, I want to share the first Tableau viz I created outside of client work – a UCONN Men’s Basketball viz!
The Viz
This past year the UCONN Men’s Basketball team took #Winning to a whole new level as they laughed all the way to the NCAA championship. The 2013-14 season was UCONN’s 4th NCAA Championship win in the last 16 years … not a bad start for Kevin Ollie’s first year as head coach.
With this year’s college basketball season well underway, it’s a good time to take a deeper look at some of the UCONN Husky’s historical trends.
Please feel free to comment. All feedback is welcome and much appreciated. Enjoy!
Chamberlaine also works for Slalom Consulting and is helping to drive growth of the data visualization practice at our Hartford office. This is Chamberlaine's first foray into the world of Tableau Public and I think its a good one. You can find her on twitter as @ChamberlaineK
Chamberlaine Kerr
Slalom Consulting – Business Intelligence
Hartford, Conn.
In February, 2012 I started my career with Slalom Consulting at our headquarters in Seattle. After roughly one-and-a-half years I relocated to Hartford, Conn., and joined Slalom’s Information Management and Analytics practice.
Prior to Slalom I attended the Foster School of Business at the University of Washington – go Dawgs! After moving to Connecticut, I quickly realized we aren’t the only Huskies around. I now refer to my alma mater as the Huskies of the Best (oops! I mean West*) coast.
I’d like to say a huge “thank you” to my Slalom Consulting colleagues Peter Gilks (for allowing me to take over his blog for the day) and Curtis Looney (for helping with the original POC). Hopefully my own blog will be a part of the not-so-distant future. In the interim, I want to share the first Tableau viz I created outside of client work – a UCONN Men’s Basketball viz!
The Viz
This past year the UCONN Men’s Basketball team took #Winning to a whole new level as they laughed all the way to the NCAA championship. The 2013-14 season was UCONN’s 4th NCAA Championship win in the last 16 years … not a bad start for Kevin Ollie’s first year as head coach.
With this year’s college basketball season well underway, it’s a good time to take a deeper look at some of the UCONN Husky’s historical trends.
Please feel free to comment. All feedback is welcome and much appreciated. Enjoy!
Wednesday, 5 November 2014
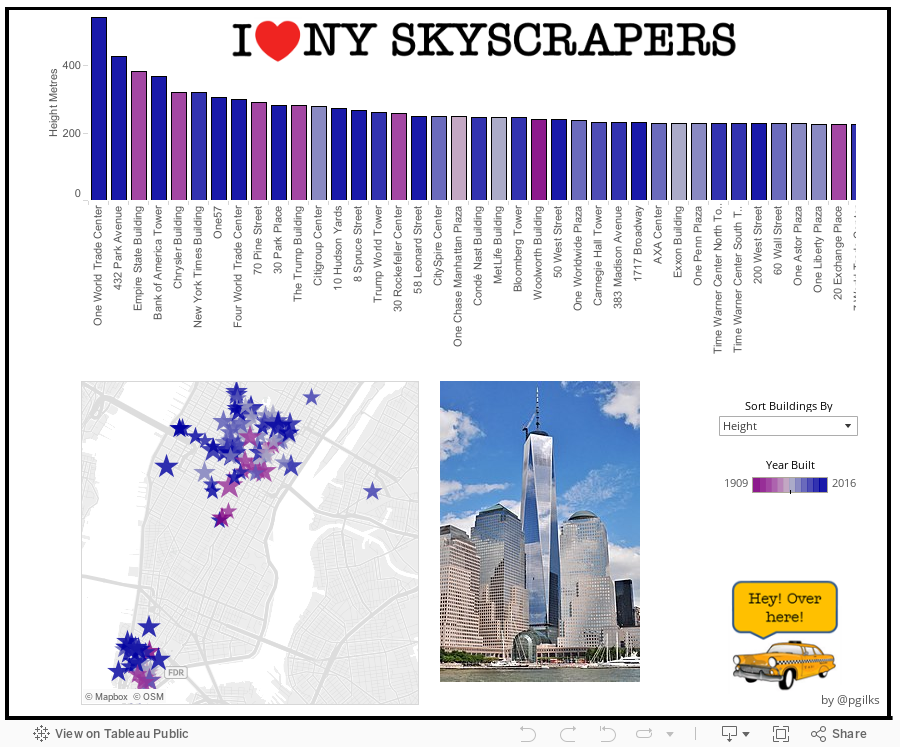
Skyscrapers in New York update
A year a go I made this blog post for Tableau Public Design Month, including a viz on the tallest buildings in New York.
Well over the last year a new very tall building has popped up in the city to take the number 2 spot away from the mighty Empire State Building and so I thought it was time for an update.
The new building is 432 Park Avenue, the tallest residential building in the Western Hemisphere. Its penthouse apartment is currently for sale listed at $95m.
432 Park Ave is part of a new craze for super skinny super tall luxury residential buildings in New York, many more of which are in the pipeline. I'm not really a fan of these new buildings, especially since many of the apartments will be bought and left empty. But whatever happens, I'll try to keep this viz up to date.
Well over the last year a new very tall building has popped up in the city to take the number 2 spot away from the mighty Empire State Building and so I thought it was time for an update.
The new building is 432 Park Avenue, the tallest residential building in the Western Hemisphere. Its penthouse apartment is currently for sale listed at $95m.
432 Park Ave is part of a new craze for super skinny super tall luxury residential buildings in New York, many more of which are in the pipeline. I'm not really a fan of these new buildings, especially since many of the apartments will be bought and left empty. But whatever happens, I'll try to keep this viz up to date.
Sunday, 5 October 2014
A Rough Guide to Tableau Dashboard Actions
As you probably can tell by now, I really enjoying building data visualisations in Tableau. Whether for this blog or for work, I strive to build dashboards that people will be able to use to explore the data at their own pace and discover their own insights.
One way I attempt to do this is by using, what I hope is, engaging visual design. The other is by building in interactive features into the dashboard that people can play with to start changing the views of the data. This is accomplished in three primary ways: Quick Filters, Parameters and Dashboard Actions. Of these three Dashboard Actions have become my favourite as they are probably the most flexible and offer the most immersive experience. So here's my rough guide to Tableau Dashboard Actions. Its not completely exhaustive, and its not particularly technical, but if you are fairly new to Tableau, or even an experienced user, I hope you will find it a useful guide.
- Filter
- Highlight
- URL
Tableau themselves provide a good run down of how to build in Dashboard Actions here http://onlinehelp.tableausoftware.com/current/pro/online/mac/en-us/actions.html. So rather than repeat what Tableau have already documented, I am going to show a variety of use cases for using Dashboard Actions and how to implement them. Those use cases are:
Use Case 1: Basic Chart to Chart Filtering
Use Case 2: Pre-Filtering a Large Table
Use Case 3: Creating a 'Cross-Blend' Filter
Use Case 4: Showing Images
Use Case 5: Dynamic Text or Titles
Use Case 6: Linking Out to Web Pages
Use Case 7: Highlighting and Labelling
Use Case 8: Switching Dashboards
Use Case 9: Mixing Things Up
One way I attempt to do this is by using, what I hope is, engaging visual design. The other is by building in interactive features into the dashboard that people can play with to start changing the views of the data. This is accomplished in three primary ways: Quick Filters, Parameters and Dashboard Actions. Of these three Dashboard Actions have become my favourite as they are probably the most flexible and offer the most immersive experience. So here's my rough guide to Tableau Dashboard Actions. Its not completely exhaustive, and its not particularly technical, but if you are fairly new to Tableau, or even an experienced user, I hope you will find it a useful guide.
What is a Dashboard Action?
A dashboard action is an interactive element on a Tableau dashboard that is driven from the worksheets within that dashboard. There are three types of dashboard action:- Filter
- Highlight
- URL
Tableau themselves provide a good run down of how to build in Dashboard Actions here http://onlinehelp.tableausoftware.com/current/pro/online/mac/en-us/actions.html. So rather than repeat what Tableau have already documented, I am going to show a variety of use cases for using Dashboard Actions and how to implement them. Those use cases are:
Use Case 1: Basic Chart to Chart Filtering
Use Case 2: Pre-Filtering a Large Table
Use Case 3: Creating a 'Cross-Blend' Filter
Use Case 4: Showing Images
Use Case 5: Dynamic Text or Titles
Use Case 6: Linking Out to Web Pages
Use Case 7: Highlighting and Labelling
Use Case 8: Switching Dashboards
Use Case 9: Mixing Things Up
Monday, 22 September 2014
2014/15 Zen Master
A couple of weeks before the Tableau Conference I received this rock in the post and it made me very happy!
I feel very honoured to have been selected and to be in the same group as all the wonderful people listed here http://www.tableausoftware.com/ZenMasters
Thank you to anyone who nominated me, I really do appreciate it and I am so happy to be involved in this community.
OK, better start thinking of my next blog post......
I feel very honoured to have been selected and to be in the same group as all the wonderful people listed here http://www.tableausoftware.com/ZenMasters
Thank you to anyone who nominated me, I really do appreciate it and I am so happy to be involved in this community.
OK, better start thinking of my next blog post......
Tuesday, 26 August 2014
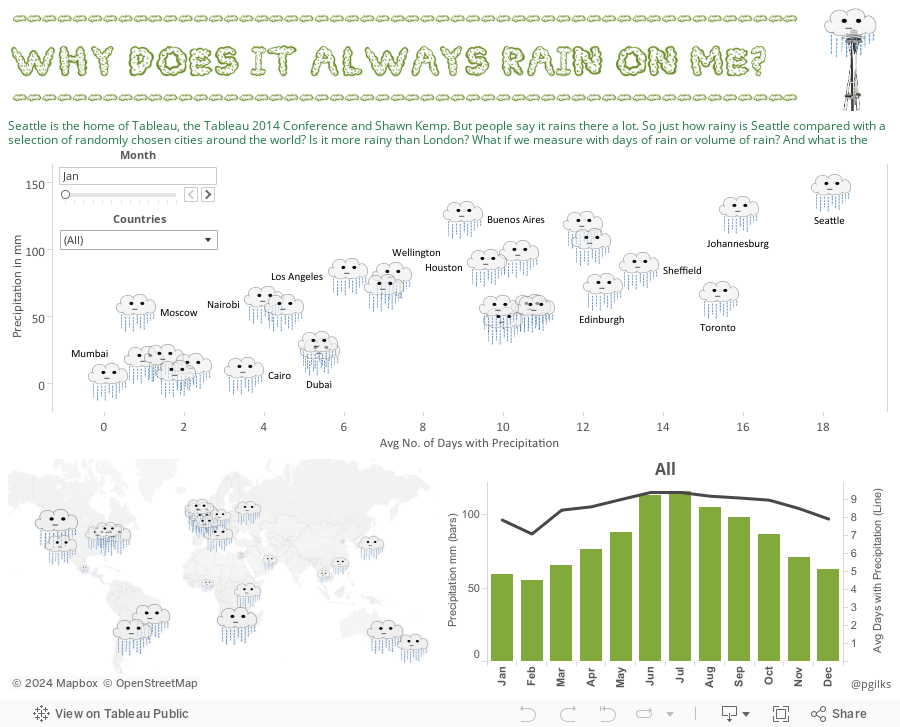
Why Does It Always Rain On Me?
We are now only a couple of weeks away from the 2014 Tableau Conference so I thought I would make a viz in honour of Tableau's home and the location of the conference this year, Seattle. Two years in row is a tradition right? Here's what I did last year
I ruled out making a Seattle Supersonics viz as it seemed just too morbid, so I went for one of the other things that Seattle is famous for - rain!
A few things I spotted in the data:
- London is nowhere near as rainy as its reputation. When I moved from London to New York I was convinced it was raining here more, and it turns out the data backs me up. Time to lay off the London weather jokes.
- Seattle does deserve its reputation for rain. It doesn't rain the most in terms of volume, but it does rain often.
- The rainy and dry season patterns of some places like Cairo and Mumbai are more extreme than I had previously thought.
I hope you enjoy exploring the viz, and please don't be offended if your city isn't on there, it was a pretty random selection apart from Sheffield where I grew up and it felt like it rained all the time.
Comments welcome, and hope to see you in Seattle! You probably won't need an umbrella in September.
I ruled out making a Seattle Supersonics viz as it seemed just too morbid, so I went for one of the other things that Seattle is famous for - rain!
A few things I spotted in the data:
- London is nowhere near as rainy as its reputation. When I moved from London to New York I was convinced it was raining here more, and it turns out the data backs me up. Time to lay off the London weather jokes.
- Seattle does deserve its reputation for rain. It doesn't rain the most in terms of volume, but it does rain often.
- The rainy and dry season patterns of some places like Cairo and Mumbai are more extreme than I had previously thought.
I hope you enjoy exploring the viz, and please don't be offended if your city isn't on there, it was a pretty random selection apart from Sheffield where I grew up and it felt like it rained all the time.
Comments welcome, and hope to see you in Seattle! You probably won't need an umbrella in September.
Subscribe to:
Posts (Atom)