Some of this will become less relevant when Tableau introduces cross database joins, and cross data source filters. But none the less it might be helpful for a while longer. It can help a lot getting around issues you may have with data blending, or with one to many joins or with avoiding having to resort to Parameters (which don't update with the data).
Example 1 - Dealing with data at different levels of aggregation
Let's say you have two lots of sales data
A. Sales per day for the last 6 weeks
B. Sales per month for the last 3 years
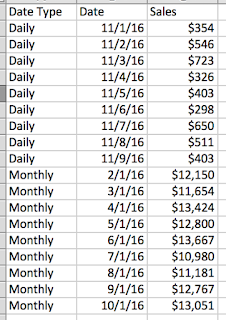
And you want to build a dashboard that allows you to switch between the two and/or you want to see data at both levels but have quick filters apply to both sets of data. Well the answer is easy - union that data!
So take the data from this:
A.
B.
(note American date format mm/dd/yy)
To something like this:
And then you can use 'Date Type' as a filter that lets you switch between the two:
The main benefit to this is flexibility to the user, but also as you are using a single data source you don't need to worry about blends or joins, and you know that any filters will work with all charts.
Another benefit is that this can be a very efficient way of working when you are dealing with very large databases. Joins can be costly from a performance point of view, and blends can be both costly and cause functionality constraints, so using a single table with a filter can speed things up.
Example 2 - Dealing with data at different stages or that has some shared fields
In this case imagine you have two sets of data for application for, and sales of, mortgages. The data shares some fields.
A. Application data
B. Sales data
A.
B.
Again, there are different ways you could deal with this data to create a dashboard, or series of dashboards. But again using blending or joins might cause some difficulty with data source filters, or if you end up with one to many joins. So a possible approach again is to Union the data and use similar fields together, and just leave blank values that don't apply to that part of the data. The resulting data might look something like this:
And again, you can use your Type field to easily switch between views, or to show both views on the same dashboard or view with a single filter for Product that doesn't rely on (undynamic) Parameters.
And that's it! You can easily extend the logic here to build out more complex data sets for different scenarios. This approach can also help with performance against 'big' data, especially if you make you Type field numeric and use it as a sorted index in your database.
Just be careful to make sure you know how you are using the Type, or similar, field in each view so that you don't double count.


What a neat take on paint by numbers, how did you come up with this? www.segmation.com
ReplyDeleteVery informative post. Thank you.
ReplyDeleteproperties for sale in coimbatore | coimbatore real estate
tks God about this number. I can know how you are. keep moving
ReplyDeletesua nha dep | tam chong am khoi | da hoa cuong | unionshirts | gearlaunch | teespring | teechip | sunfrogshirts | snorgtees | bonfire funds | promopays | elephant shirt | diversethreads | viralstyle | teezily