
Now what I'm not going to do here is talk about Context Filters in terms of performance. My experience with using context filters to improve performance is very hit and miss, sometimes it works, sometimes it slows things down and sometimes there is no difference. This all depends on your data connection type, the size and width of your data and what you are trying to achieve with the filter. For improving performance with context filters I suggest you utilise the ever popular 'try it and see' approach. I am going to talk about Context Filters in terms of functionality and give some examples.
First up, how do I make a regular filter a Context Filter?
This one's easy - you simply right click on your filter pill (or click the drop down arrow) and select 'Add to Context'.


You will notice that the filter pill turns grey. This is, in classic subtle Tableau style, your clue that the filter is 'in context.
Also worth noting is that context filters can be for single sheets, multiple sheets or all sheets. But it will be in or out of context for all sheets, you can't apply to many sheets and then switch in and out of context on different sheets.
Aggregation based filters (e.g. sum(sales)) cannot be added to context.
What does a Context Filter actually do?
In simple terms, putting a filter in context ensures that all other filters are dependent on that Context Filter. Tableau filters otherwise act independently and this is a useful feature, but may sometimes mean that filtering doesn't do what you might first expect it to do.
Also worth understanding is the order of operations that Tableau uses for applying filters. Unfortunately Tableau's own documentation for this is fairly thin on the ground, but various bloggers and folks on the Tableau forum have provided insight. Here's the view I refer to these days, provided by Alexander Mou on his excellent blog.
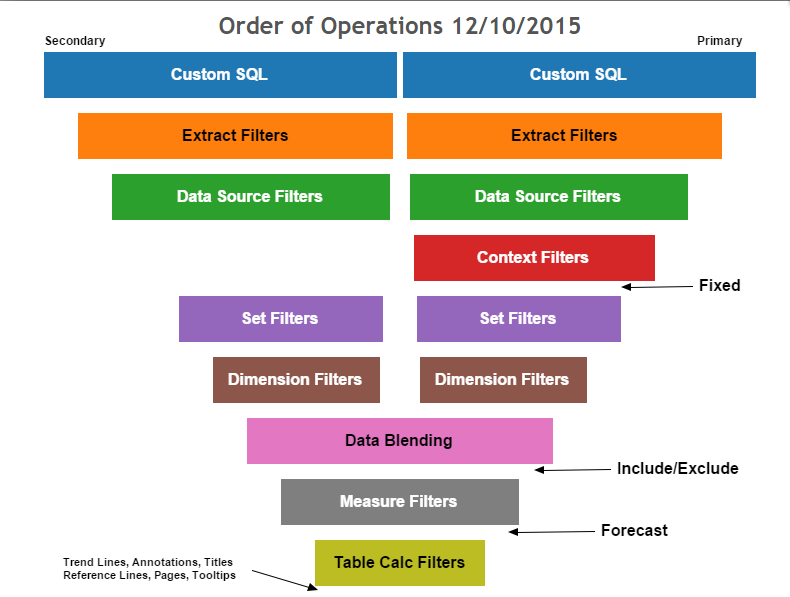
For now, don't worry about the Secondary Data Source line, just concentrate on the Primary Source.
Note here that 'Set Filters' don't just include things you've put specifically into a Set, but also include Top N and conditional filters. The fact that these occur before Dimension Filters is one of the things that make Context Filters so important, as we'll see later.
The key thing here is to notice that Context Filters will also logically apply before any other filters you add.
By the way, the knowledge base on the order of operations is always growing and changing as the product develops, and many smart Tableau community folks have added to it. See work here by Jonathan Drummey and Joe Mako for example. The Tableau forums have lots of content on this subject.
What is happening behind the scenes?
Utilizing a Context Filter does one of three things behind the scenes, depending on the type of data source you are using:
1) For flat tables like Excel and some databases like MySQL it creates a temporary table in which all context filters have been applied as 'WHERE' clauses. This temporary table is then used for further queries.
2) For some databases it forces each query to also utilize a sub-query which selects the items in context. It does this in Amazon Redshift. I'll show how this works in my second example so keep reading.
3) Nothing. By that I mean that the filter will behave the same way whether you placed in context or not.
The fact that it can actually execute one of three different things behind the scenes adds to the mystery of whether or not using a context filter will actually improve performance. Take it case by case and experiment.
Ok now time for some concrete examples:
Example 1: Generating Top N Lists
Let's say you are using the Superstore sales data set and you want to identify the top 10 selling product items in the Furniture Department. Well how might you do that? Let's first set up a list showing all items, sorted by total sales, and their accompanying department.

Now I want to filter to the top 10, so I'm going to place 'Item' onto the filters shelf and do a Top N filter.

And then I'm going to add Department to the filter shelf as well and select 'Furniture'. Makes sense right?

Oh crap! What happened?!?! Why do I only have a top 3 and not a top 10?
Well that's because the top 10 filter is applied by Tableau BEFORE the Department filter. It just so happened that 3 items from the Furniture Department were in the overall top 10 selling items.
If I want to get the top 10 Furniture items, I need to add Department to context, so that its the first filter applied.....


Bingo!
Now if I add a date filter into the mix, note that the order of the top 10 items changes, but the item names do not.....

I'm now showing the sales within a selected time period per item, for the top 10 items from the entire dataset time period. See the logical mismatch? Again, If I want to show the top 10 items in the time period selected I need to add this to context. The tricky thing here is that its not as immediately obvious that you aren't returning what you want in the same way as when we noticed only 3 items. So be careful!

Notice that the items in the list have now changed? 'Office Star...' wasn't there until we added Order Date to context.
Example 2: Conditional Filters (and Sets)
The concept here is very similar the one above. Consider a conditional filter such as 'show me items that have at least $30,000 of sales in Europe'.
So lets first bring in all our items again and apply a conditional filter.


WTF! I thought I filtered out everything under $30,000!?!?!
Yet again, the conditional filter is applied BEFORE the Continent filter, and so what I'm actually displaying is the sum of sales in Europe for those Items that have at least $30,000 of sales globally. Not really what I wanted. You know the solution by now, add that filter to context!

and if you are working with a conditional Set, exactly the same rules apply


For you SQL heads, here's what's going on in the back, in the case where you are using a dimensional database that writes a sub-query.
Without the context filters, the SQL will look something like this (remember to imagine this is a dimensional data model):
SELECT Item,
SUM(Sales) AS Sales
FROM salestable
INNER JOIN countrytable ON (salestable.countrykey = countrytable.countrykey)
INNER JOIN (
SELECT Item
FROM salestable
GROUP BY 1
HAVING (SUM(Sales) > 30,000)
) "jointable" ON salestable.Item = jointable.Item
WHERE countrytable.continent='Europe'
GROUP BY 1
Where as with the context filter it will look something like this:
SELECT Item,
SUM(Sales) AS Sales
FROM salestable
INNER JOIN countrytable ON (salestable.countrykey = countrytable.countrykey)
INNER JOIN (
SELECT Item
FROM salestable
INNER JOIN countrytable ON (salestable.countrykey = countrytable.countrykey
where countrytable.continent='Europe'
GROUP BY 1
HAVING (SUM(Sales) > 30,000)
) "jointable" ON salestable.Item = jointable.Item
WHERE countrytable.continent='Europe'
GROUP BY 1
Notice how the 'Europe' clause is now in both the sub-query and the main query? (please excuse me if that SQL isn't perfect, but I think you'll see what I mean)
Example 3: Action Filters as Context Filters
Lets swing back to Example 1, displaying the top 10 products in the Furniture Department. Well what if this was in a dashboard that allowed users to use an action to drive the top 10? Sounds like a nice little dashboard, and you know I love using dashboard actions!
Here's what the dashboard looks like, plus the filter action:


I suspect you've already figured out what's going to happen when I click on Furniture....

yep I only see the 3 Furniture items that just happen to be in the top 10 overall. So how do I put this action filter into context? Well the first thing to realize is that you can't do this while setting up the dashboard, because you can't actually see an action filter on the filters shelf until it has been 'activated' or clicked. So in this instance you need to go to the dashboard, click the part of the screen that activates the action filter and then go into the sheet (or sheets) that have been filtered:

Spot the action filter on the Filters shelf, and add it to context:

And then when its turned grey you will notice that we now see the top 10 Furniture Items:

And the dashboard is ready to use.

Note that if your dashboard action affects more than 1 sheet, then you do have to go into each affected sheet and one by one add that action filter to context, it does not automatically apply to all sheets.
Remember again that it might not be immediately obvious that your action filter isn't doing what you expect it to, the results might look reasonable at first glance. So be very careful. Sometimes if you are not sure its worth just trying putting your filter into context to see what changes.
Shout out to the Information Lab here, they have some nice tutorials on using action filters in context like this one and this one.
Example 4: Level of Detail Calculations
NOTE 16 Nov 2015 - This section only applies to FIXED calculations and not EXCLUDE or INCLUDE. See comments by Jonathan Drummey in the comments section below.
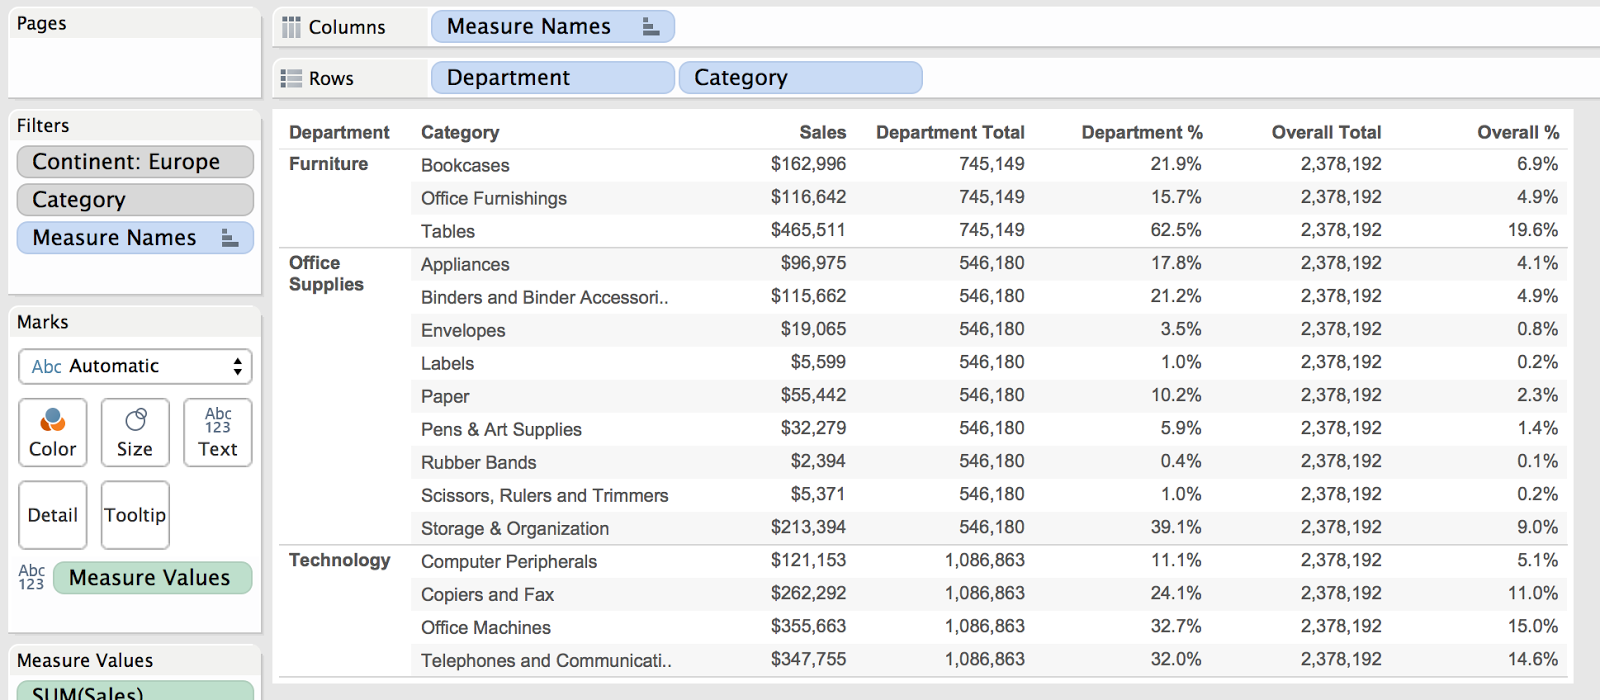
Simple example again here, I'm going to use an LOD calc in order to calculate the % of total sales that come from each product category within each department. For something like this, even if I want to end up with a chart, I like to start with a table so I can see clearly the calculations happening.


Now lets say I decide to no longer stock 'Chairs & Chairmats' and so for my analysis I want to exclude them. Well if I filter them out, my LOD calc for Department Total doesn't change and so my % no longer adds up to 100% for the Furniture Department.

Unless of course I add that filter to context:

Similarly I could add a field that isn't in the view as a filter, and watch how the LOD driven totals don't change, throwing off my calculation, until I add it into context:


BUT there are times with LOD calcs that you don't want to add a filter to context. Lets say I want to see ONLY Furniture categories, but I want to know their % of the TOTAL sales. I would use these calcs to get the total and the new %:


and then see what happens when I add Department as a regular filter:

which is what I wanted, versus using Department as a Context Filter:

which gives me redundant numbers. So as you can see, when you are using LOD calculations, think carefully about which filters you want to be visual only (regular filters) and which filters you want to apply to the calculation itself (Context Filters)
Wrapping up
I hope you found that intro to Context Filters and the examples helpful, if you have any other good examples please feel free to mention them in the comments section and as usual all comments and corrections are welcome!
Hi Peter,
ReplyDeleteNice post, thank you! Bethany Lyons also gave a great talk at TC15 that was focused almost entirely on the cool things you can accomplish by adding LOD Calcs into the context. Those who are interested should search out & watch the recording:
LODs of Fun with Jedi Filters: Level Of Detail Calcs for Data Geeks
Thanks!
Keith Helfrich | Twitter
Red Headed Step Data
Thanks Keith, I'll give that one a watch myself.
DeleteHi Peter,
ReplyDeleteThis is great! I've got two clarifying comments:
- The section on LOD expressions is incomplete because it doesn't talk about the distinction between FIXED LODS vs. INCLUDE & EXCLUDE LODs. While FIXED LODs behave exactly as you describe, INCLUDE & EXCLUDE LODs are computed as aggregates, i.e. after dimension filters are applied.
- Alexander has been doing some good work on diagramming the order of operations, and the diagram you included is inaccurate because data blending happens after dimension filters are applied. See http://community.tableau.com/message/434964#434964 for the latest comments.
Jonathan
Hi Jonathan,
Deletethanks for the feedback. Yes you are right about INCLUDE/EXCLUDE, I'll take another look at the wording of the LOD section I think - my confession is that I never use INCLUDE or EXCLUDE because I find it conceptually hard to keep track of what its doing versus what I think its doing. And I haven't yet found a situation that multiple FIXED calcs won't cover instead. So I totally forgot about them when writing this, but I'm probably just being lazy :-)
And thank you for the link the order of operations conversation, I need to take some time to digest it. Wouldn't it be nice if Tableau themselves could post a definitive version of this?
The order of operations diagram is updated again on 12/10/2015. The change is to make dimension filters take precedence over data blending.
Deletehttp://vizdiff.blogspot.com/2015/12/the-order-of-operations-diagram-update.html
This comment has been removed by a blog administrator.
ReplyDeleteThis comment has been removed by a blog administrator.
ReplyDeleteThis is a great article thanks for sharing this informative information. I will visit your blog regularly for some latest post. I will visit your blog regularly for Some latest post.
ReplyDeleteTableau Consultants
In the event that you are always out and about a ton, ensure you carry your center work with you. Having a tablet that has all the same data as your desktop is vital to staying gainful out and about. Here are some tips for staying gainful out and about. Place to jot things down
ReplyDeleteteechip
ReplyDeletefabrily
sunfrog coupon
teezily
snorgtees
redbubbles
funny dog tshirts
dog night shirts
dog sport shirts
bonfire funds
shirtmagic
merchify
design4t
viralstyle
sell my tees
custom ink coupon
ooshirts coupon
vistaprint
bigfrog
5 shirts
designashirt
shirtcity
theprintful
threadmeup
unionshirts
gearlaunch
teespring
sunfrogshirts
badideatshirts
mostexpensivedog
dragonee
viralstyle
teezily
ooshirts
gearbubble
skreened
Very nice introduction, even freshers also can easily understand thank you for sharing this article with us. Know more about Tableau Training in Bangalore
ReplyDelete