
Here I will do my bit for the understanding of Log Scales and will use the example of the heat of chilli's to show both how they work and why they can be useful in data visualisation.
So how do Logarithmic Scales work? Well wikipedia says this "The logarithm of a number is the exponent by which another fixed value, the base, must be raised to produce that number."
If we take the number 10,000 and we use the base 10, to get from 10 to 10,000 we must raise it by the power 4: 104 = 10,000, so the logarithm of 10,000 is 4. Likewise the logarithm of 100,000 is 5, the logarithm of 1,000,000 is 6 and so on. Not all logarithmic scales use base 10, any base is possible, but it is the most commonly used. (The base 2 logarithm of the number 16 for example is also 4 because 24 = 16).
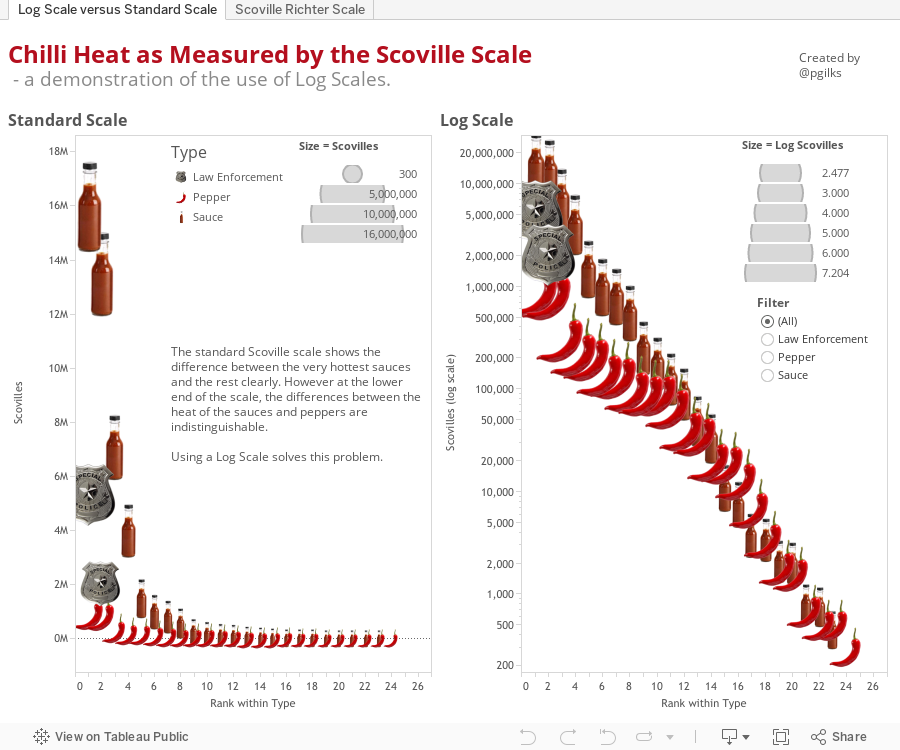
So how do we use logarithmic scales in data visualisation? Take a look at the first tab of the viz below. You will see two charts side by side, the first shows a selection of chilli peppers, hot sauces and pepper sprays mapped by their number of Scoville units. Scoville units are a measure of heat in food, for more information on the Scoville Scale take a look at http://en.wikipedia.org/wiki/Scoville_scale .
The vertical axis shows the number of Scoville units for each item, and the horizontal axis simply ranks the items within their categories (so the hottest sauce and pepper are both at place 1 on the scale). This first viz is quite useful, we can tell straight away that the sauce 'Blair's 16 Million Reserve' is way way way hotter than most of the other sauces and peppers. And for anyone who has ever got chilli in their eyes, you can also see that getting hit in the face with pepper spray probably isn't much fun. However what's harder to distinguish are the differences between the sauces and peppers at the lower end of the scale. For example the Pimento pepper is a lot less hot (by a factor of at least 10 in fact) than the Jalepeno, but its hard to tell on the standard scale.
This is where the logarithmic scale comes into its own. Tableau uses the base 10 logarithmic scale as its default, and you can see on the second viz that this has been applied on the vertical axis. Now the differences in heat (as measured by Scovilles) are much clearer, all across the scale. You can also see how using a log scale might come in useful when trying to identify patterns and relationships. When a variable is working on a power scale, using the log makes spotting relationships much easier.
This work then led me on to thinking about a possible adaptation of the Scoville scale to make it more like the Richter scale. The second tab in the Tableau viz above shows how this might look, using a base 10 log to give each pepper, sauce or spray a score. This has now become a linear scale where one movement in the scale implies a 10 times increase in heat from the chilli. I've got a feeling the sauce buying public might quite enjoy this system of measurement, imagine buying you hot wings on the same basis as people measure earthquakes? For now I'm going to call this the Scoville Richter Scale on which Original Tabasco scores a 3.6, Franks Red Hot a 2.7 and Habneno peppers a 5.4. It looks like the 7.3 score of Blair's 16 Million Reserve might be the hottest score possible as its made from capsaicin capsules (http://en.wikipedia.org/wiki/Capsaicin) but you never know.
Notes: Data for this viz was sourced from a number of websites, mainly wikipedia and http://www.chilliworld.com/FactFile/Scoville_Scale.asp . Where peppers are known to have a range of Scoville scores, I've used the mid point. The list I've presented certainly isn't an exhaustive list of sauces or peppers. And for the record, I'm a bit of a wuss when it comes to hot food, I probably wouldn't venture beyond a 4.5 on the Scoville Richter Scale.....
Isn't the scoville scale linear though?
ReplyDeleteyes, that's why I experimented with adapting it to be a log scale
Delete