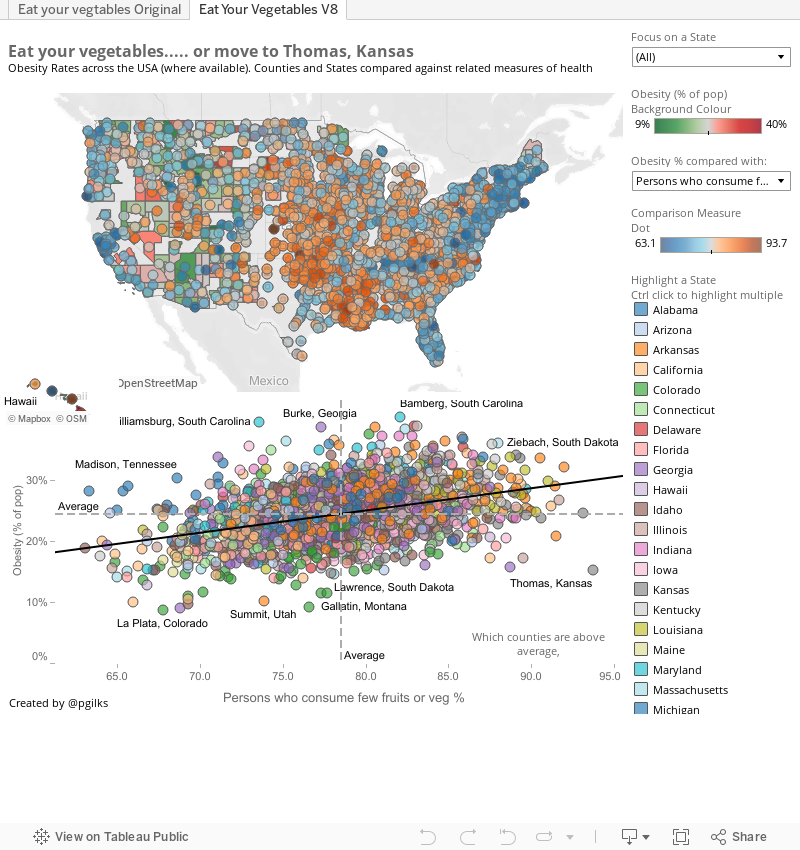
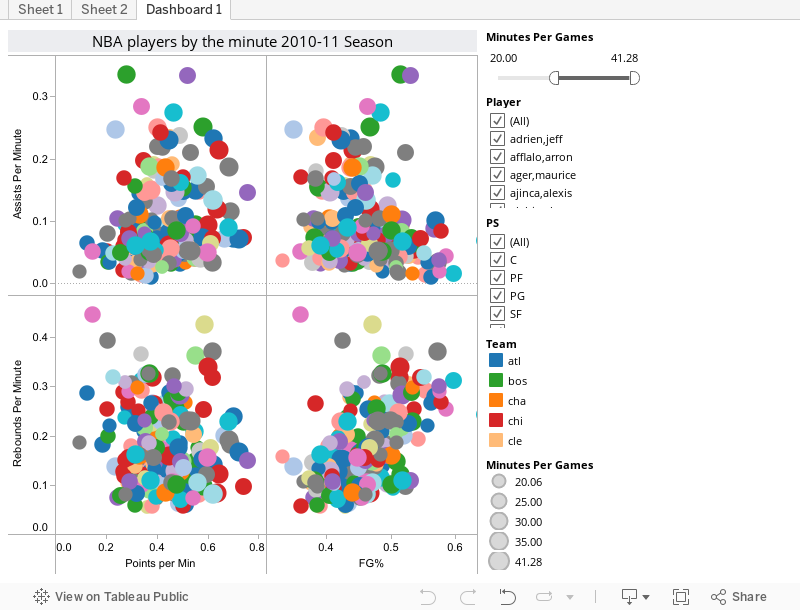
Well Tableau have launched a competition to make over in Tableau 8 one of the vizes previously built in Tableau 7 and published on the Tableau Public Gallery. http://www.tableausoftware.com/public/elite-8 Below is my effort.
My understanding of the competition (which may be wrong!) is to give the viz a makeover, rather than a complete redesign from scratch. So I've kept the basic format of the original, map followed by scatter plots. Plus I love scatter plots!
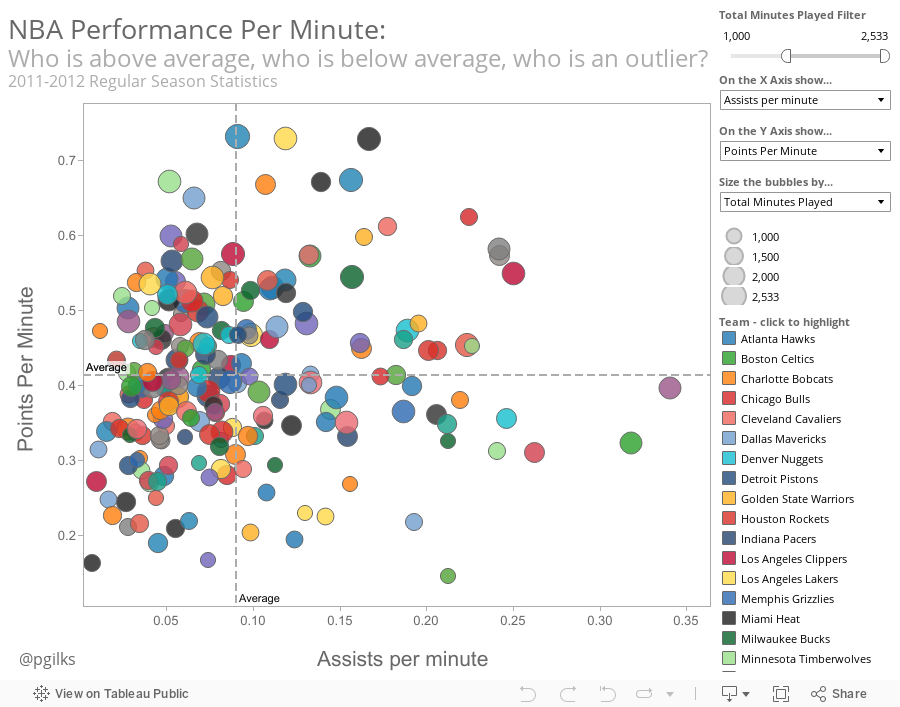
I've actually not used too much of the version 8 functionality in this instance as I didn't think that the new chart types for example would be relevant to this data set. Instead I've tried to open up the dashboard a bit, to show the national picture, to make comparisons between states and counties easier using colour and, as with my NBA viz below, to make it easier to spot outliers. I've not sized the bubbles as I don't like to repeat measures in bubbles, I would have sized by population if available.
One thing I have done with the new functionality is use the floating tiles quite subtly, allowing Hawaii to appear in the national picture, and placing a decent paramter based x axis label in the scatter plot.
Content wise, most of the links with obesity are well known. lack of exercise and poor diet lead to obesity, which in turn leads to health problems such as high blood pressure. this is well known and established so I didn't think there was much point trying to emphasise this too much (though it is there). Most interesting to me are the geographic differences, especially the outliers. For example, what are folks in Lawrence Kansas doing to stay trim? There are two tabs. One shows my version in Tableau 8, the other shows the original.
Comments?