
I was having a hard time thinking of how to get to some useable data for niche topics, and in the end decided I could make a better viz by using one of the datasets that Tableau suggested, this being facebook usage statistics by country.
And so I re-drew the map of the world, sizing countries by their populations of facebook users. And for reference you can use the parameter controls to show alternate versions sized by actual population or internet using population. Doing this reveals clearly how big an impact the restriction on facebook in China has.
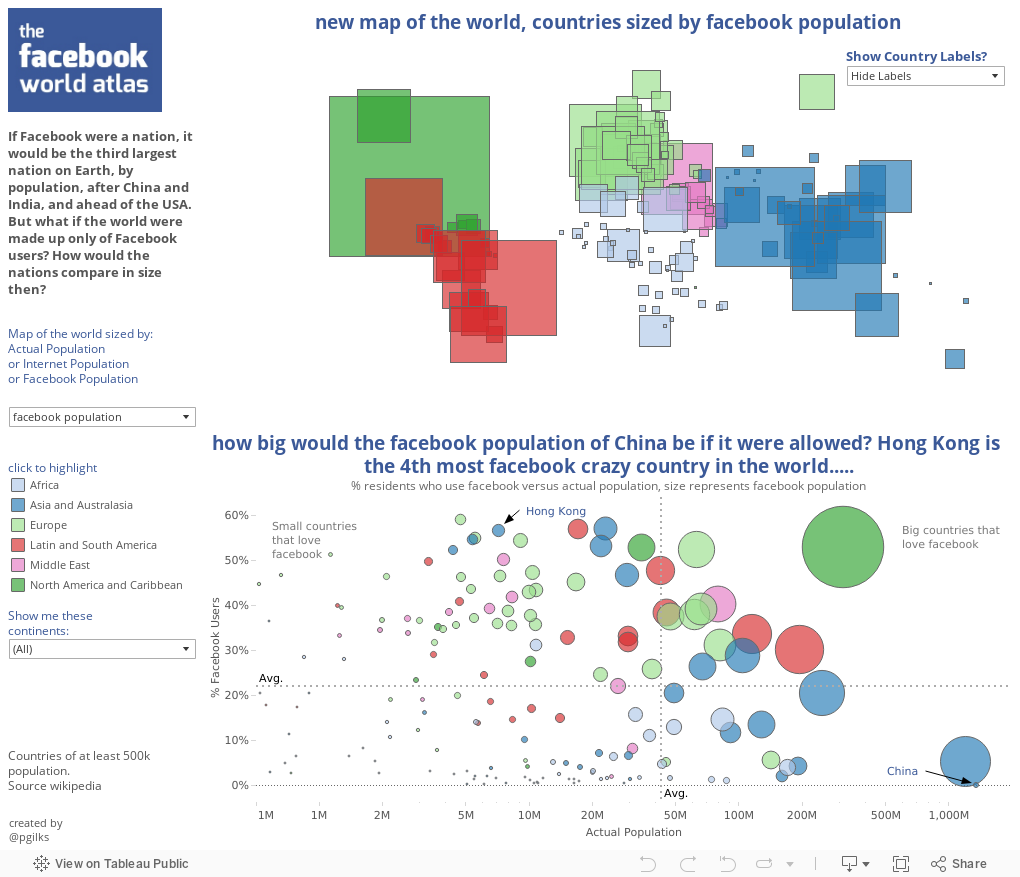
What do you think?
By the way, the font I used is not the same the one facebook uses, but is similar, the title uses Exo, the body uses Lucida Sans.
Awesome work, Peter. Really I'm new to data visualization but it's a field I'm in very interesting. I would like to know if you had to write any codes to get this done.
ReplyDeleteDo reply.
Hi Olisa, thanks for the comment. I did the whole thing in Tableau, so it was mostly point and click. I did have to write a small amount of code within Tableau to produce calculated fields, but very little (see my other posts for the kind of things to do). You can have a go yourself by downloading Tableau Public, its free!
ReplyDeleteGreat article Lot's of information to Read...Great Man Keep Posting and update to People..Thanks
ReplyDeleteinstagram photos
I want you to thank for your time of this wonderful read!!! I definately enjoy every little bit of it and I have you bookmarked to check out new stuff of your blog a must read blog!!!! Local Contractors
ReplyDelete